Brio Maps
User Guide for web-based Briometrix Mobility MapsBriometrix Effort-Based Mobility (Brio) Maps provide a guide to how easy it is to travel along a path or trail. See below for:
What is a Briometrix Mobility Map?
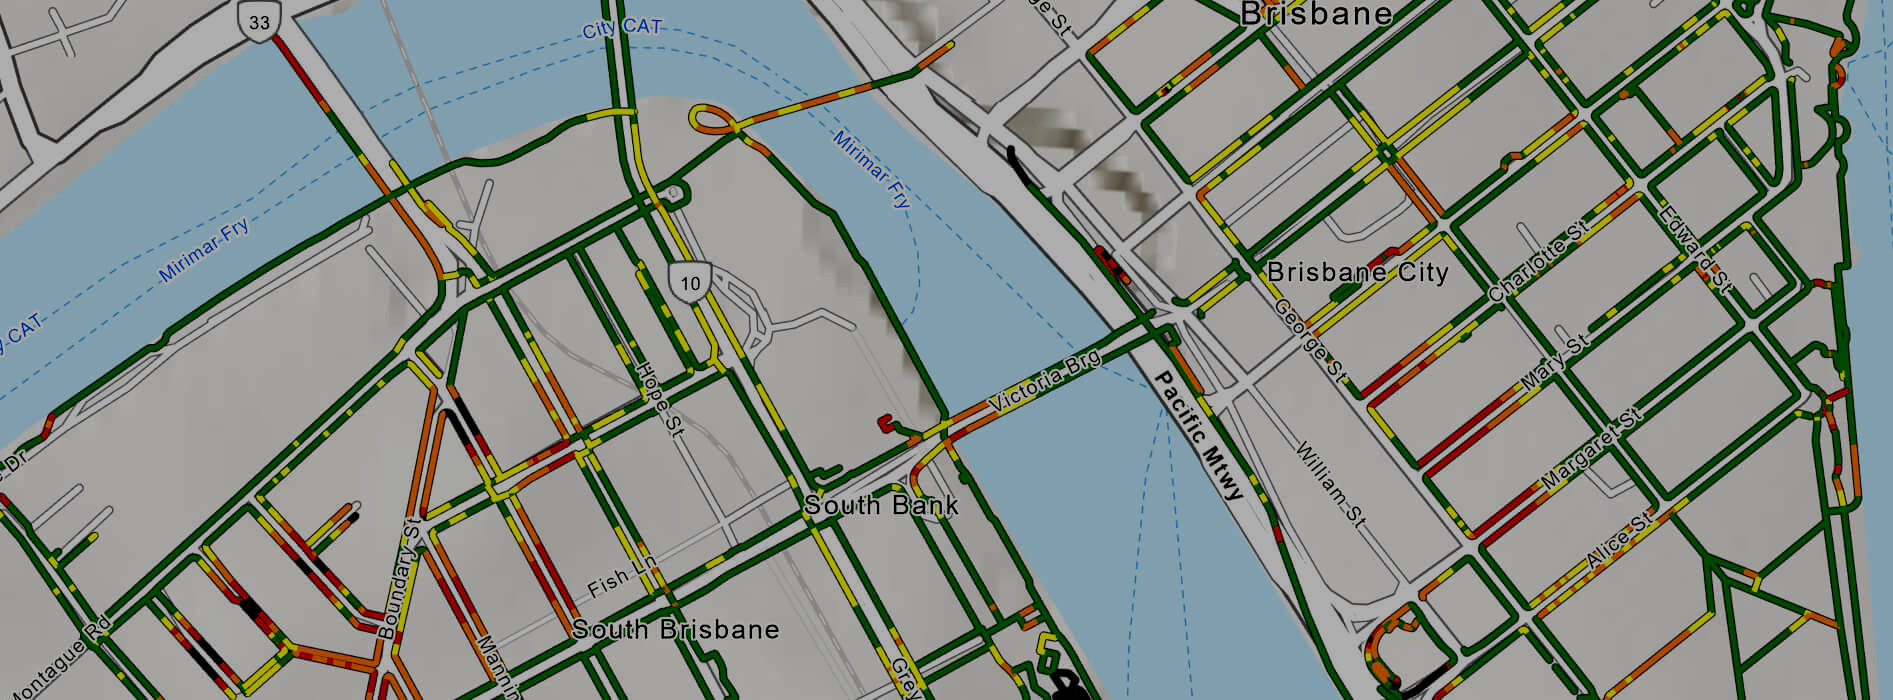
Briometrix Mobility Maps (Brio Maps) are created by Briometrix on behalf of cities, towns, greenways, universities, national parks and public transportation systems.
Brio Maps are intended to help people plan an outing, visit destinations and safely navigate to public transport connections such as trains, trams and buses. The maps uniquely show all footpaths or trails in the mapped areas as colour-coded lines indicating the level of difficulty for a person with limited mobility to get from one place to another.
During your outing in the mapped areas, you can open the map on your mobile device, zoom in and set “My Location” on so the map will follow automatically as you move about, making it easier to make choices on which path to take.
Effort Rating
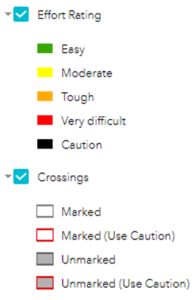
Briometrix Effort Rating gives a general guide on how difficult it is for a wheelchair user to push along the section of pathway. The rating is based on gradient, crossfall and surface condition.
How this affects individual users will depend on their physical condition and how their wheelchair or other mobility device is equipped.
Crossings
Marked Street Crossings are those where there are traffic lights that control pedestrian flows (also known as Pelican crossings) or marked Zebra crossings. A red border suggests caution because of one or more challenging or hazardous Kerb Ramps.
Unmarked Crossings (no lights or Zebra) can also have a red border because of a more challenging Kerb Ramp.
Where an existing crossing has been found to be too hazardous for a wheelchair user, it is not marked as a crossing.
Transport Icons
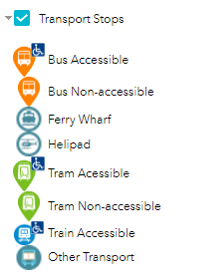
Transport icons can be viewed and toggled on or off from the legend and layers menu.
All Transport icons are “touchable”, with a URL that reveals more details about that stop, including a detailed model of all accessibility-related features such as shelter, Myki machines, next tram buttons, assisted boarding locations and toilets.
Notes:
⦁ Accessible Bus Stops require a bus fitted with a wheelchair access ramp.
⦁ Accessible Tram Stops have platforms allowing level access onto trams. Not all trams on these routes have level floors internally.
⦁ Non-Accessible Bus and Tram Stops are shown without the accessible symbol and are not suitable for boarding or disembarking with a wheelchair.
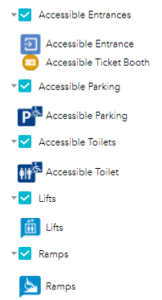
Map Icons
All icons on the map can be viewed and toggled on or off from the legend and layers menu.
Notes:
⦁ Accessible Parking and Toilets display a wheelchair symbol.
⦁ Accessible Parking locations show the number of accessible bays if there is more than one.

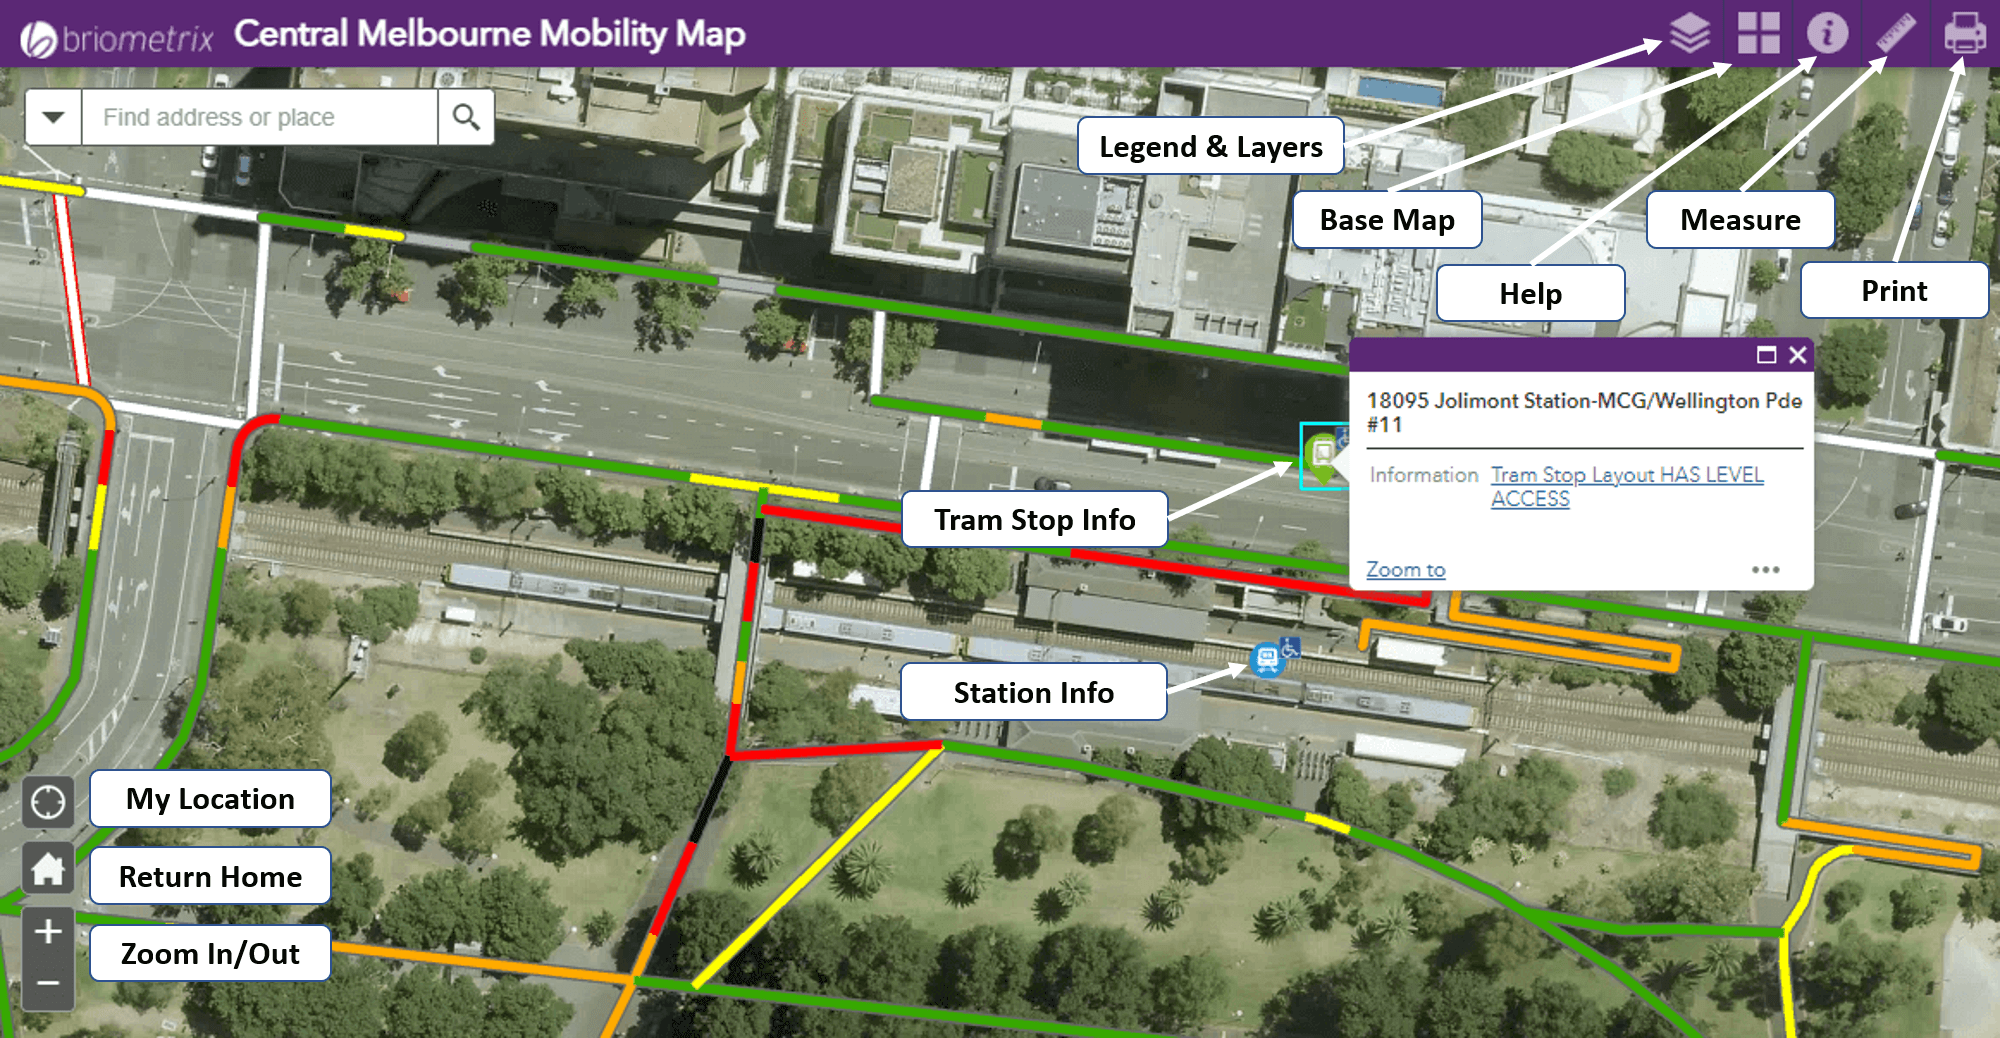
Legend & Layers
Select Layers to turn on or off using the checkboxes, then to View the Icons for a Layer, tap its text label.
See Effort Rating, Crossings, Transport Stop Icons and Map Icons above.

Base Map
Shows a Base-Map Gallery from which you can change the map’s background to Topographic, Satellite Imagery or Open StreetMap.
NOTE: In the Legend and Layers Menu, the last selection displays MetroMap high resolution Aerial imagery, overlying your current Base-Map selection. Uncheck MetroMap to show the current Base-Map.

Help
Learn more about the local Mobility Map project, (including video interviews with the wheelchair pilots that captured the data), and access the online map User Guide.

Measure
Measure distances or areas
For distances, you can click continuously to get an accumulated total distance (double-click to stop).
For Areas, click around an shape and double-click to calculate its area.

Print a copy of the current screen. This pops a dialog box with controls for printing. We suggest selecting “Format PDF” and then click “Advanced” button to choose:
⦁ “Preserve Map Extent”, and
⦁ “Scale Bar Unit Meters”
On completion of the print process, click on the document URL to open the printed PDF map, which you can save to your PC or mobile device.

My Location
Pans the map to centre on your current location (estimated by your device).
If you are moving using a mobile device (i.e. GPS-equipped), the map will scroll with your current location at the centre.
If you manually zoom or pan, the My Location function is toggled off, until you select this button again.
Note if you are not in the Mobility Map area when you turn on My Location, you will be panned to your current location.
Simply tap “Home” to return to the original Mobility Map “Home” view.
When My Location is “on”, you can turn it off by tapping the My Location button again (Square symbol).

Home
Return to original Mobility Map View
The extents of the mobility data are stored with the map. This button zooms you back to the “Home” view from any current location.

Zoom In/Out
Use these buttons Zoom in and out, remaining centred at the current location. On your PC you can also scroll your mouse roller.
If you’re on a Smartphone, you can also use the usual pincer movement to Zoom In and Out.
Pan
To PAN (move the map in any direction), on your PC click on the map and slide in the desired direction while holding your mouse button down, or use your touch-pad.
You can also use arrow keys on your PC to move in any direction.
If you’re on a Smartphone, you can Pan using a two-fingers swipe on the map.
Other Features

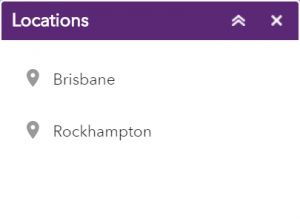
Choose a Location (Optional)
Where multiple locations are available for this map, you can select from a drop-down menu – the map will zoom to the selected location.

Search
Search for nearby locations or facilities (uses ESRI’s global database of places.)

Lat/Long and Scale
Displays current Latitude/Longitude of map centroid.
The scale bar shows current scale.
Tap the crosshairs to the left of the scale bar to enable Coordinate readout (in this mode you can click anywhere to have the Lat/Long of that point displayed).
How Mobility Maps are made
Created using Briometrix wheelchair technology, our mapping service measures gradient, cross-fall and surface condition along with the propulsive force exerted by our wheelchair pilot, to rate the effort needed to go along the path at that location.
The Effort Rating is color-coded so you can judge whether this route is suitable for you.
How this rating affects your journey will depend on your personal fitness, physical condition and the type of mobility aid you use. For wheelchair users, it will depend on how chair is equipped.
Browser Support
Briometrix Effort-based Mobility Maps are currently published as ESRI ArcGIS Web Maps, which supports these browsers:
- Windows PC: Google Chrome, Mozilla Firefox, Microsoft Edge
- Apple Mac: Safari
- iPhone and iPad (iOS): Chrome, Safari
- Android Phones & Tablets: Chrome


